Krembo Rebels
Building the reporting layer I spent twenty months needing
Twenty months at Krembo running client accounts taught me exactly what reporting was missing. Then I architected, built and deployed the multi-tenant analytics platform that fixed it, solo.
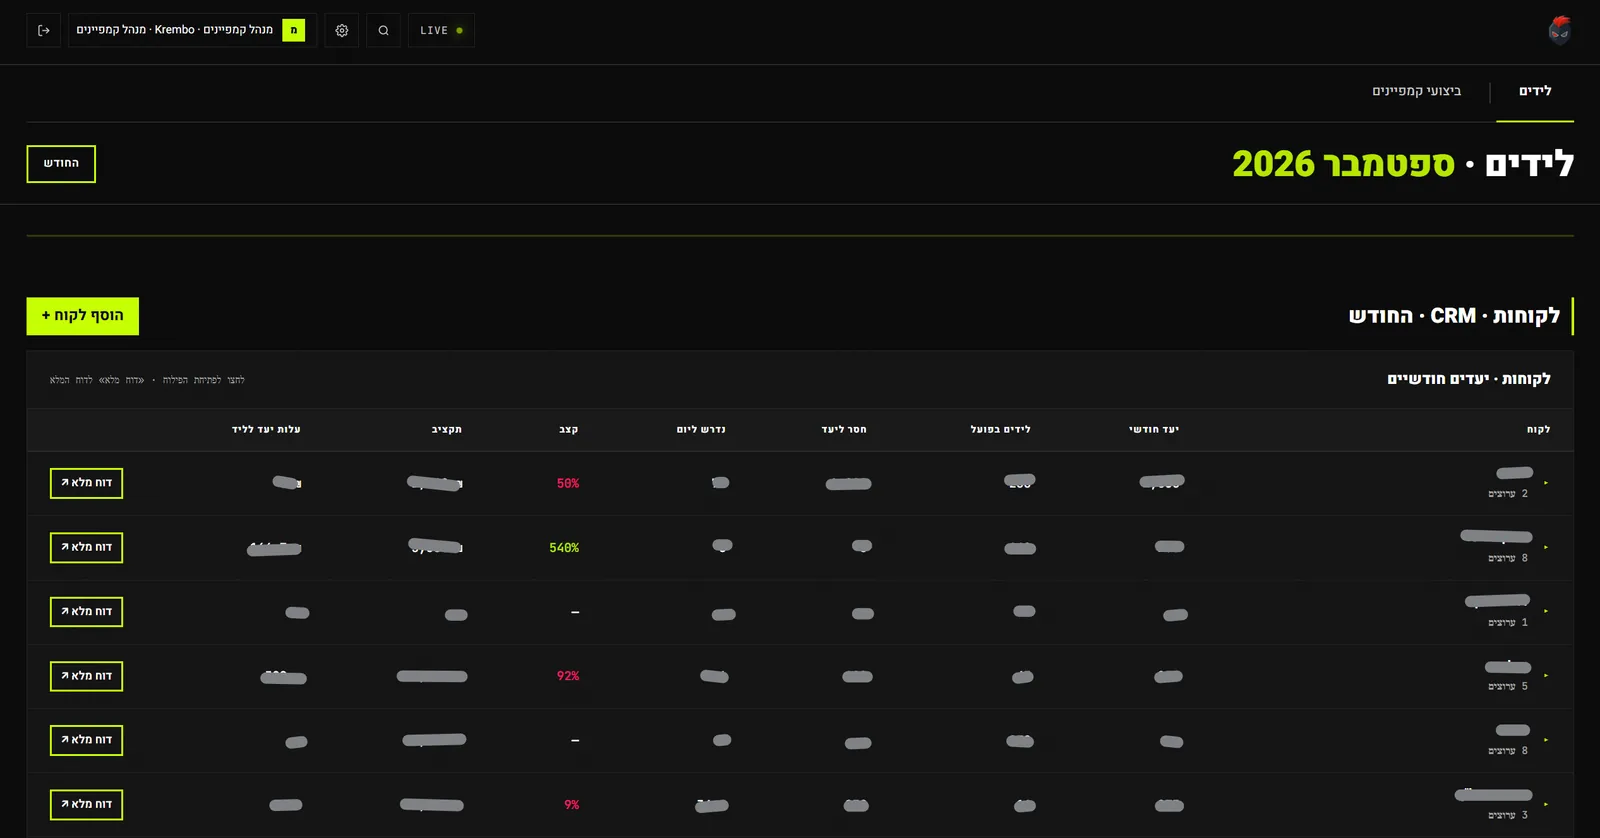
Krembo Rebels is a digital agency. I joined as a Product Manager in May 2024 and spent twenty months running client delivery; since January 2026 I have been a part-time product, AI and automation consultant there. This case study is about the analytics platform I built in the second role. It only exists because of the first.
Challenge
By the end of that stretch I owned delivery, account roadmaps and stakeholder communication across 12 concurrent client accounts spanning fintech, e-commerce and real estate, up from 8 under the previous manager. I absorbed the extra four by rebuilding how the work was planned and tracked, and by introducing Monday.com company-wide: the boards, the automations, the reporting views and the permissions, then onboarding non-technical staff onto all of it.
Running twelve accounts surfaces the same problem every month. Client reporting was assembled by hand from six separate sources that did not talk to each other: Meta, Google Ads, Google Analytics, Taboola, LinkedIn and the CRM. Nobody could compare one client's performance against another without rebuilding the comparison from scratch, and every account manager who wanted a number had to go and get it themselves. The work I most wanted to do, the funnel work, was the work the reporting overhead kept eating.
That funnel work is worth naming, because it is what the platform was built to protect. Owning Krembo's digital magazine end to end as a product, I instrumented the full path from ad impression to submitted lead, ran stage-level A/B testing to isolate where drop-off occurred, then redesigned ad creative, hook placement, questionnaire design and CTA visibility against the results, with client lead-quality feedback closing the loop. Every funnel I redesigned lifted conversion by approximately 20%.
On a client's secondary-shares trading platform I grew daily signups from 3 to 15 within a month, by redesigning onboarding, shortening the path, replacing open questions with structured options, adding process transparency and repositioning the primary CTA. The campaign changed in the same month, so I cannot split the credit between the product work and the acquisition work. Both moved, the result is real, and I would stagger them if I ran it again.
None of that is possible at twelve accounts if the reporting is manual.
What I did
I solved it twice, and the order matters.
First, an LLM automation. Rather than jump to a platform, I built something that pulled the numbers from Meta and Google and sent a daily report, the smallest thing that removed the manual assembly. It is still running today, which is the point: it earned its place before anything bigger was justified.
Then the platform, once the automation showed its ceiling. A daily report tells you what happened; it cannot be filtered, searched, or compared across clients, and it only covers two of the six sources. That gap is what the platform exists to close.
I architected, built and deployed a multi-tenant client-facing analytics platform solo, from a validated MVP to live production, directing Claude Code across Supabase, GitHub and Vercel. I do not write the code. I made every product and architecture call, specified it, reviewed it and tested what came back.
I consolidated all 6 live data sources, Meta, Google Ads, Google Analytics, Taboola, LinkedIn and the CRM, into a single comparative layer, with filtering, search and cross-client comparison, so performance could be read side by side rather than reassembled each month. It replaces the daily report with the full picture rather than a slice of it.
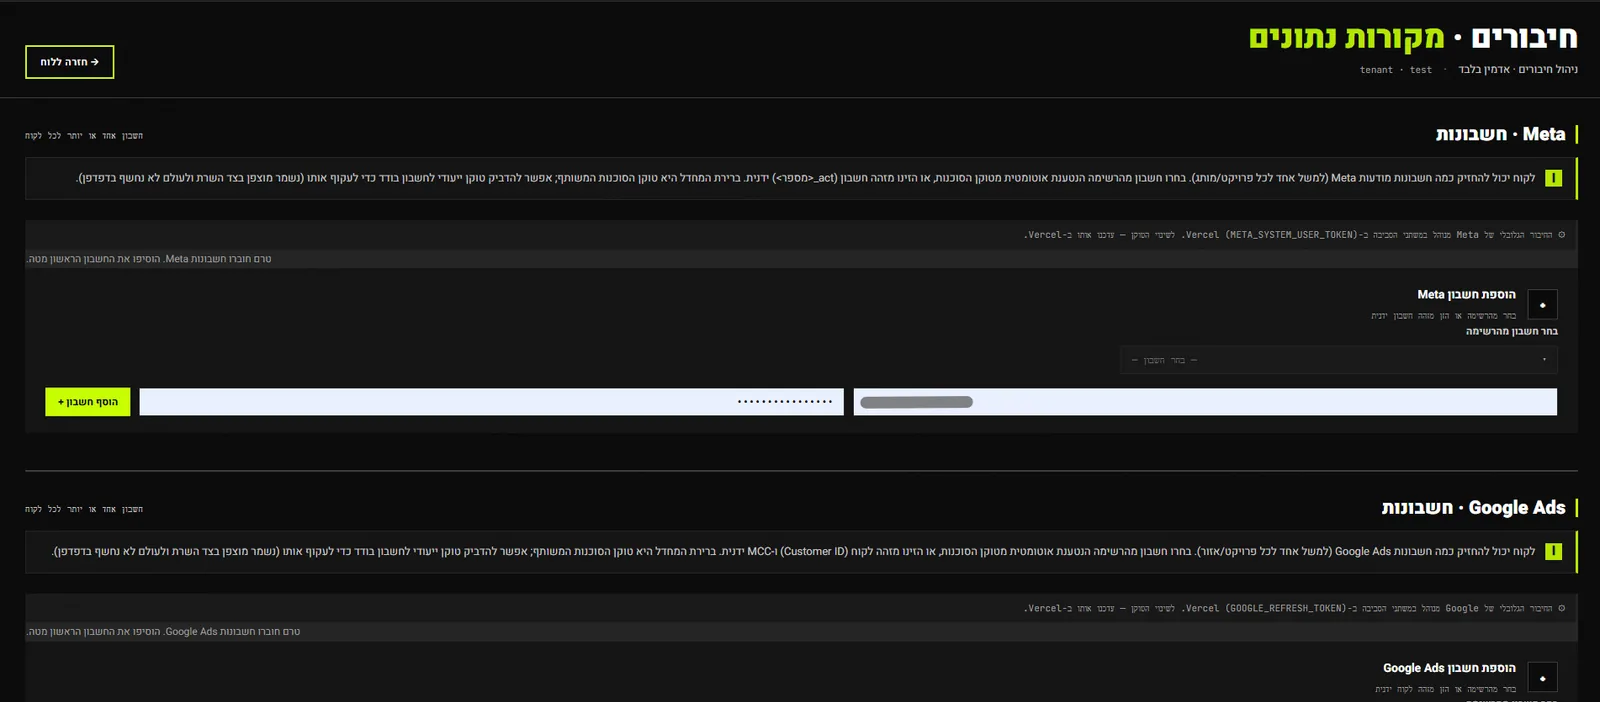
Behind it sits a two-tier permission model, agency admin against scoped client views. The design constraint that mattered most was who operates it: non-technical teams had to be able to onboard a new client without engineering support. A reporting tool that needs a developer to add a customer is a reporting tool that stops being used.
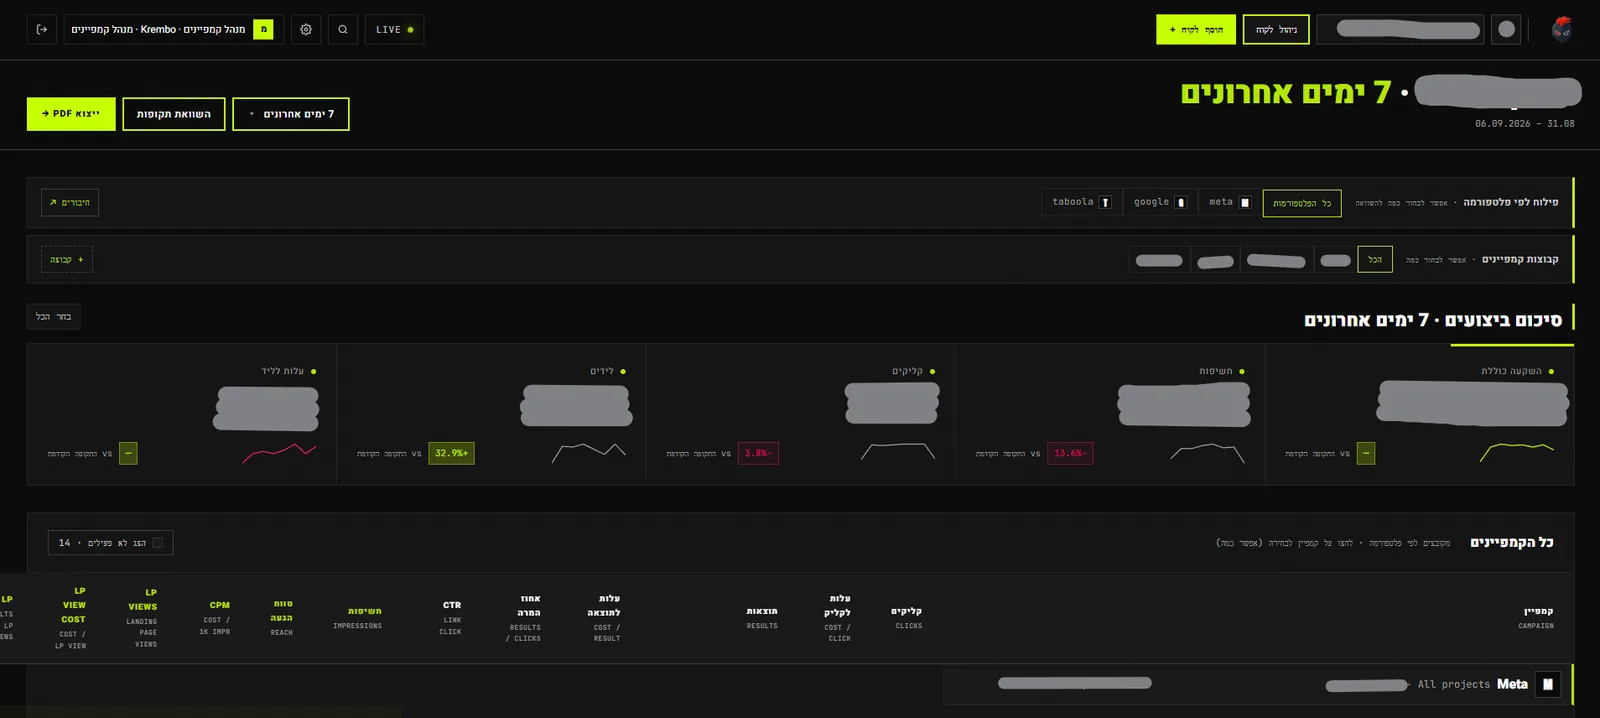
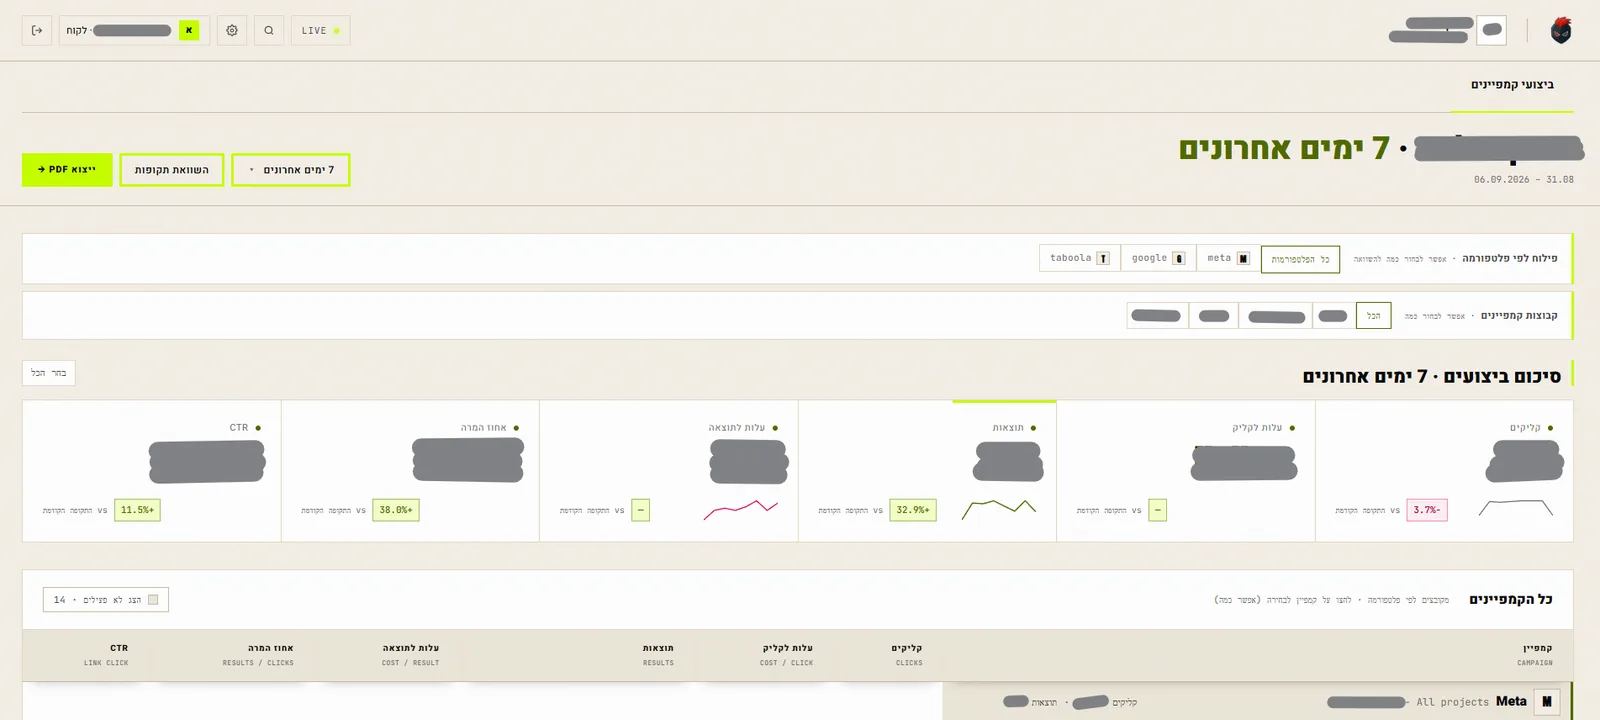
The reporting automation is one of two internal LLM-powered tools I built and deployed, both now used daily by non-technical teams. The second cut article publishing lead time by 75%. For both I wrote and tuned the prompts myself, and benchmarked their output against work the team had already published rather than against my own judgment of what looked right. The team's existing work was the only standard that mattered, and it was already sitting there to test against. Every generation was reviewed by a person before it went out, and there was no scored eval set.
Outcome
The reporting outcome I can point at is not a number. Clients used to ask for reports. The report now arrives on its own every day, and the requests stopped.
The platform is running in production with its first client on it. There is no feedback from that client yet, so there is nothing here about adoption or satisfaction, and I would rather say that than invent it. Remaining features sit in a prioritised backlog, held deliberately until there is evidence from current usage to rank them against.
Learning and reflection
The best specification I have written came from being the user for twenty months. I knew what the reporting layer had to do because I had spent twenty months working around its absence. That is not a repeatable advantage, and it is worth being honest that most product decisions do not come with it.
Directing an AI coding agent is a product skill, not an engineering shortcut. The platform exists because the scope was decided, sequenced and held. The model wrote code quickly in whatever direction it was pointed, which makes the pointing the entire job.
Delivering is not the same as being finished. The backlog is deliberately unbuilt. Having the ability to add features quickly makes it easier, not harder, to add the wrong ones, so the rule I set was that nothing else gets built until usage says which thing is missing.